Blu Mint Digital scanned 211 Australian business domains, confirmed 162 were running Elementor, and pulled Chrome User Experience Report (CrUX) field data alongside Lighthouse lab diagnostics for every site. Among the 78 sites with enough real-user traffic for a CrUX sample, only 21 passed all three Core Web Vitals (27%). Zero sites failed Interaction to Next Paint (INP), 87% passed Cumulative Layout Shift (CLS), and Largest Contentful Paint (LCP) caused almost every failure. Neither plugin count, HTML weight nor upgrading to Elementor 4.x meaningfully predicted which sites failed.
Most WordPress speed advice repeats the same three prescriptions: deactivate plugins, shrink HTML weight, and update Elementor. Two of those are things agencies routinely bill for. When we tested all three against 162 live Australian Elementor sites, none of them explained which sites failed real-user Core Web Vitals.
Here is the full methodology, the distributions, the three null results, and what we actually check first when diagnosing a slow Elementor website in Australia.
Summary of benchmark findings
| Metric or test | Sample | Observed result |
|---|---|---|
| Domains scanned | 211 Australian sites | 172 returned readable HTML; 162 confirmed running Elementor |
| Sites with CrUX real-user data | 78 of 162 | 21 passed all three Core Web Vitals (27%) |
| Field median LCP vs lab median LCP | 78 field / 162 lab | 2,928ms field median vs 4,098ms Lighthouse lab median |
| Interaction to Next Paint (INP) | 58 sites with INP CrUX | 93% good, 0% poor (worst measured: 292ms vs 500ms poor threshold) |
| Cumulative Layout Shift (CLS) | 78 sites with CLS CrUX | 87% good, median 0.00, only 3 sites poor |
| Plugin count vs performance score | 162 sites | r = -0.183 (explains roughly 3% of score variance) |
| HTML document size vs performance score | 162 sites | r = -0.033 (no meaningful relationship) |
| Elementor 3.x vs Elementor 4.x | 42 vs 112 sites | Identical median Lighthouse performance score of 57 |
How the data was collected
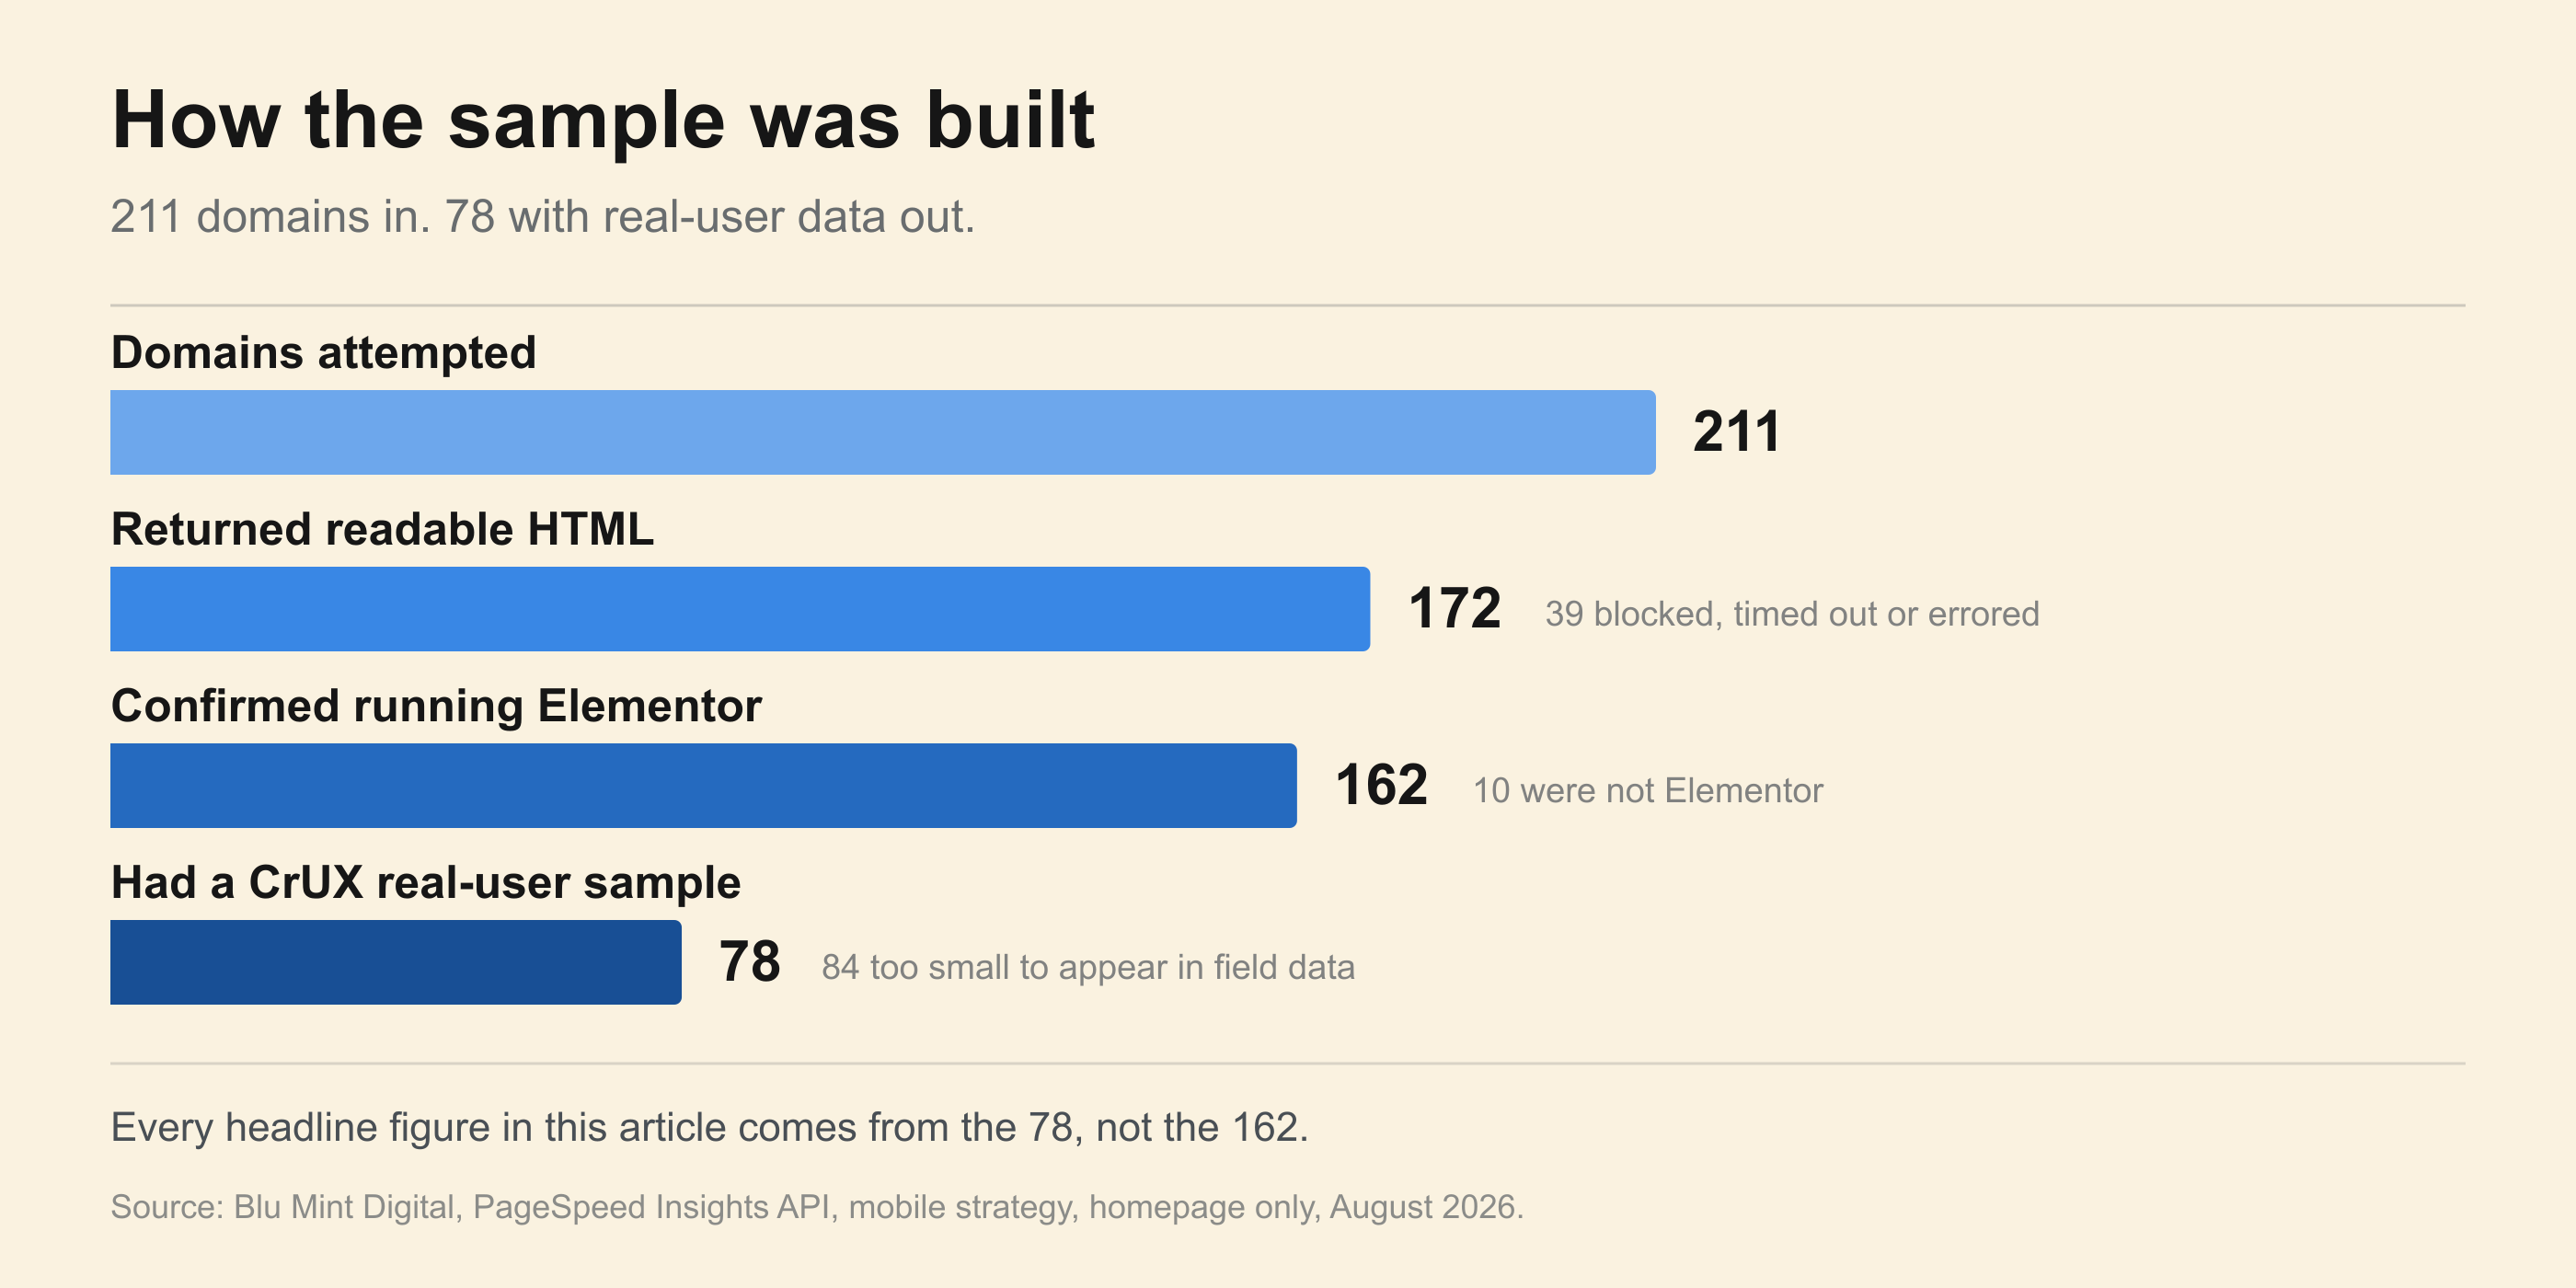
Every headline Core Web Vitals pass rate in this study comes from the 78 sites with real-user CrUX data, so the sampling funnel matters before you trust any number below it.
We started with 211 Australian business domains. A total of 172 returned HTML our scanner could read. The remaining 39 timed out, errored, or returned a 403 status, including 24 sites where a web application firewall (WAF) blocked automated requests.
That WAF exclusion matters, and it cuts against a simplistic anti-Elementor story. Websites behind managed firewall protection are more likely to sit on better-resourced hosting, which means our sample almost certainly excludes part of the faster tail.
Of the 172 readable sites, 162 were confirmed to run Elementor by inspecting asset paths, the elementor-frontend script, and Elementor markup classes. Elementor version numbers came from the ?ver= query string on core assets. Active plugin counts were estimated by counting distinct /wp-content/plugins/ directories referenced in homepage HTML, excluding Elementor itself so it would not count equally against every site.
Performance measurements came from the Google PageSpeed Insights API using the mobile strategy, one run per homepage.
PageSpeed Insights returns two distinct measurements that should never be mixed together:
- Field data comes from the Chrome User Experience Report (CrUX): real Chrome users on real phones and real Australian mobile and Wi-Fi connections, aggregated over 28 days.
- Lab data comes from Lighthouse simulating a page load on a throttled 4G connection and a slowed CPU.
Across our dataset, 78 of the 162 Elementor sites had enough traffic for a CrUX sample and 84 did not. Across all 162 rows, the Lighthouse lab median LCP was 4,098ms. Across the 78 sites with CrUX data, the real-user field median LCP was 2,928ms. Same sites, same day, nearly a 1.2 second gap. Whenever an audit quotes Lighthouse lab timers for low-traffic sites and labels them "real user experience", it is misrepresenting diagnostic simulation as visitor reality.
The Core Web Vitals result: one bottleneck, not three
Google grades three Core Web Vitals, and passing the assessment requires hitting the "Good" band at the 75th percentile on all three:
- Largest Contentful Paint (LCP): how long until the largest visible element finishes rendering. Good is under 2.5 seconds; poor is over 4.0 seconds.
- Interaction to Next Paint (INP): how quickly the page responds when someone taps or clicks. Good is under 200ms; poor is over 500ms.
- Cumulative Layout Shift (CLS): how much visible layout jumps around during loading. Good is under 0.1; poor is over 0.25.
21 of 78 sites passed all three metrics (27%).
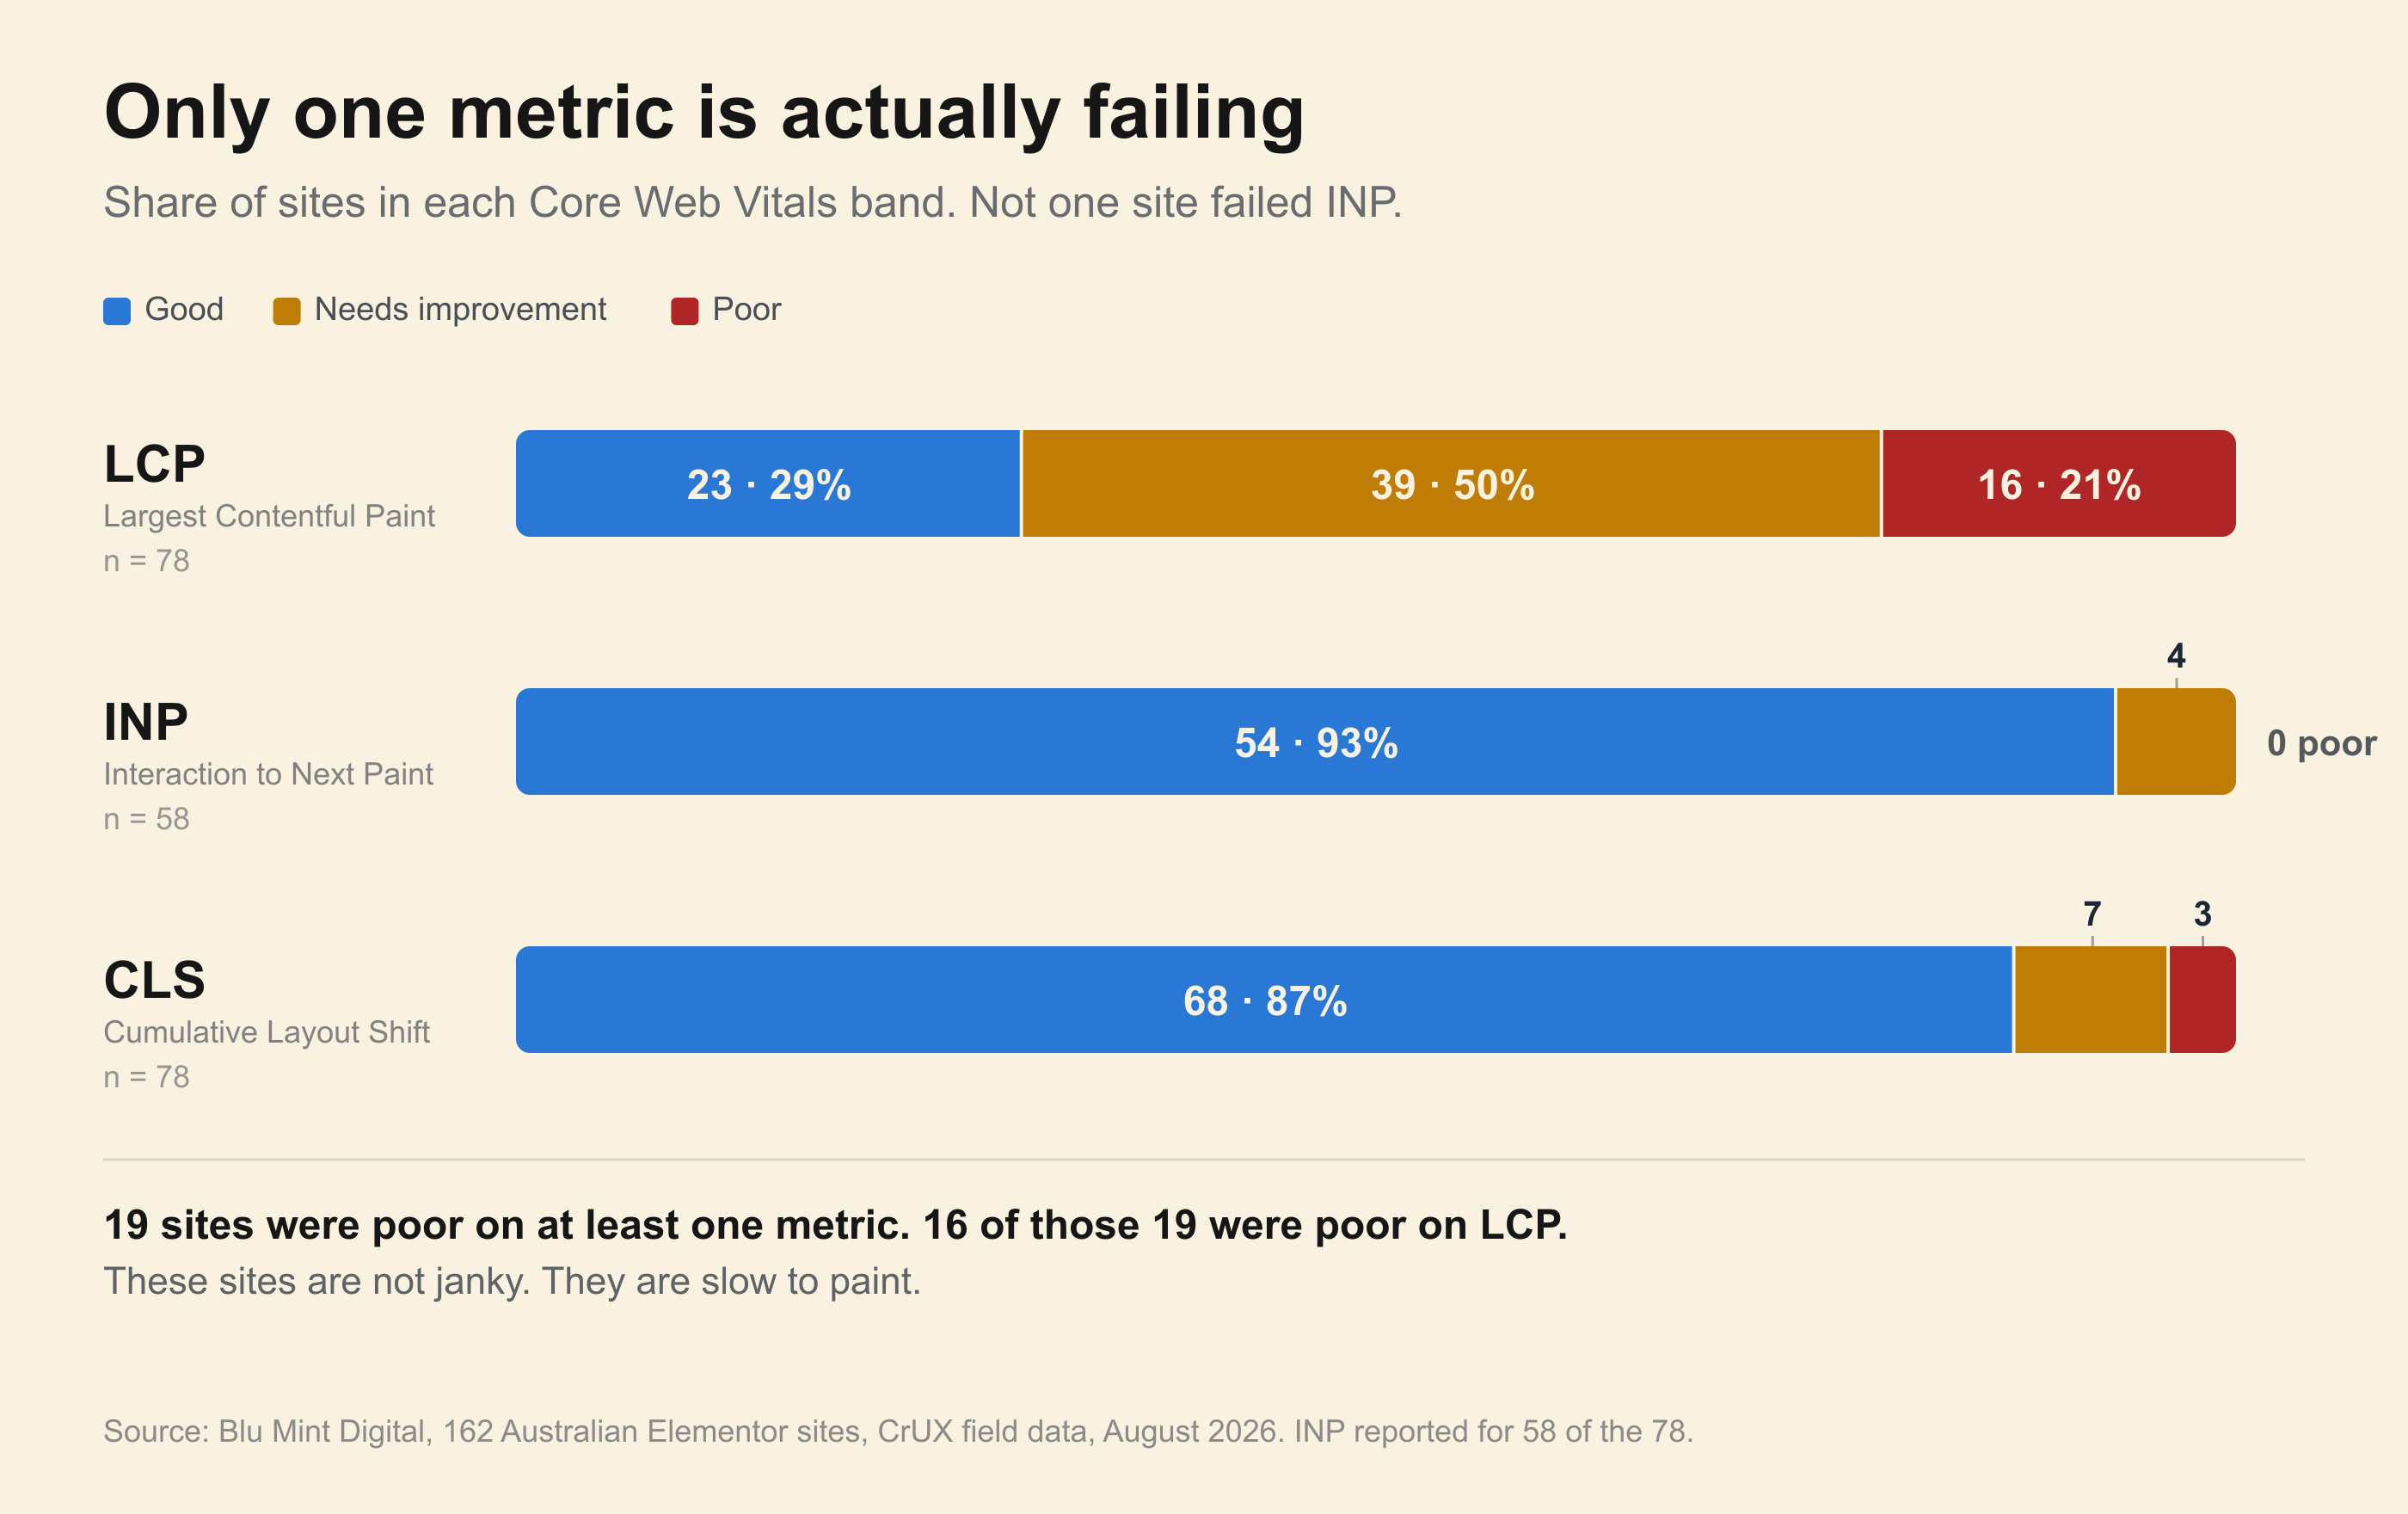
Look closely at the three bars, because the most useful finding is not the 27% overall pass rate.
Not one site in the CrUX sample failed INP. The slowest interaction latency recorded anywhere in the dataset was 292ms against a poor threshold of 500ms. Layout stability was nearly as strong: the median site scored 0.00 on CLS, and only three sites landed in the poor band.
Nineteen sites were rated poor on at least one Core Web Vital. Sixteen of those nineteen were poor on LCP.
In practice, these Australian Elementor websites are not jittery or unresponsive once loaded. They respond to taps promptly and their layouts stay still. Their problem happens before the visitor touches anything: they paint their opening screen too slowly.
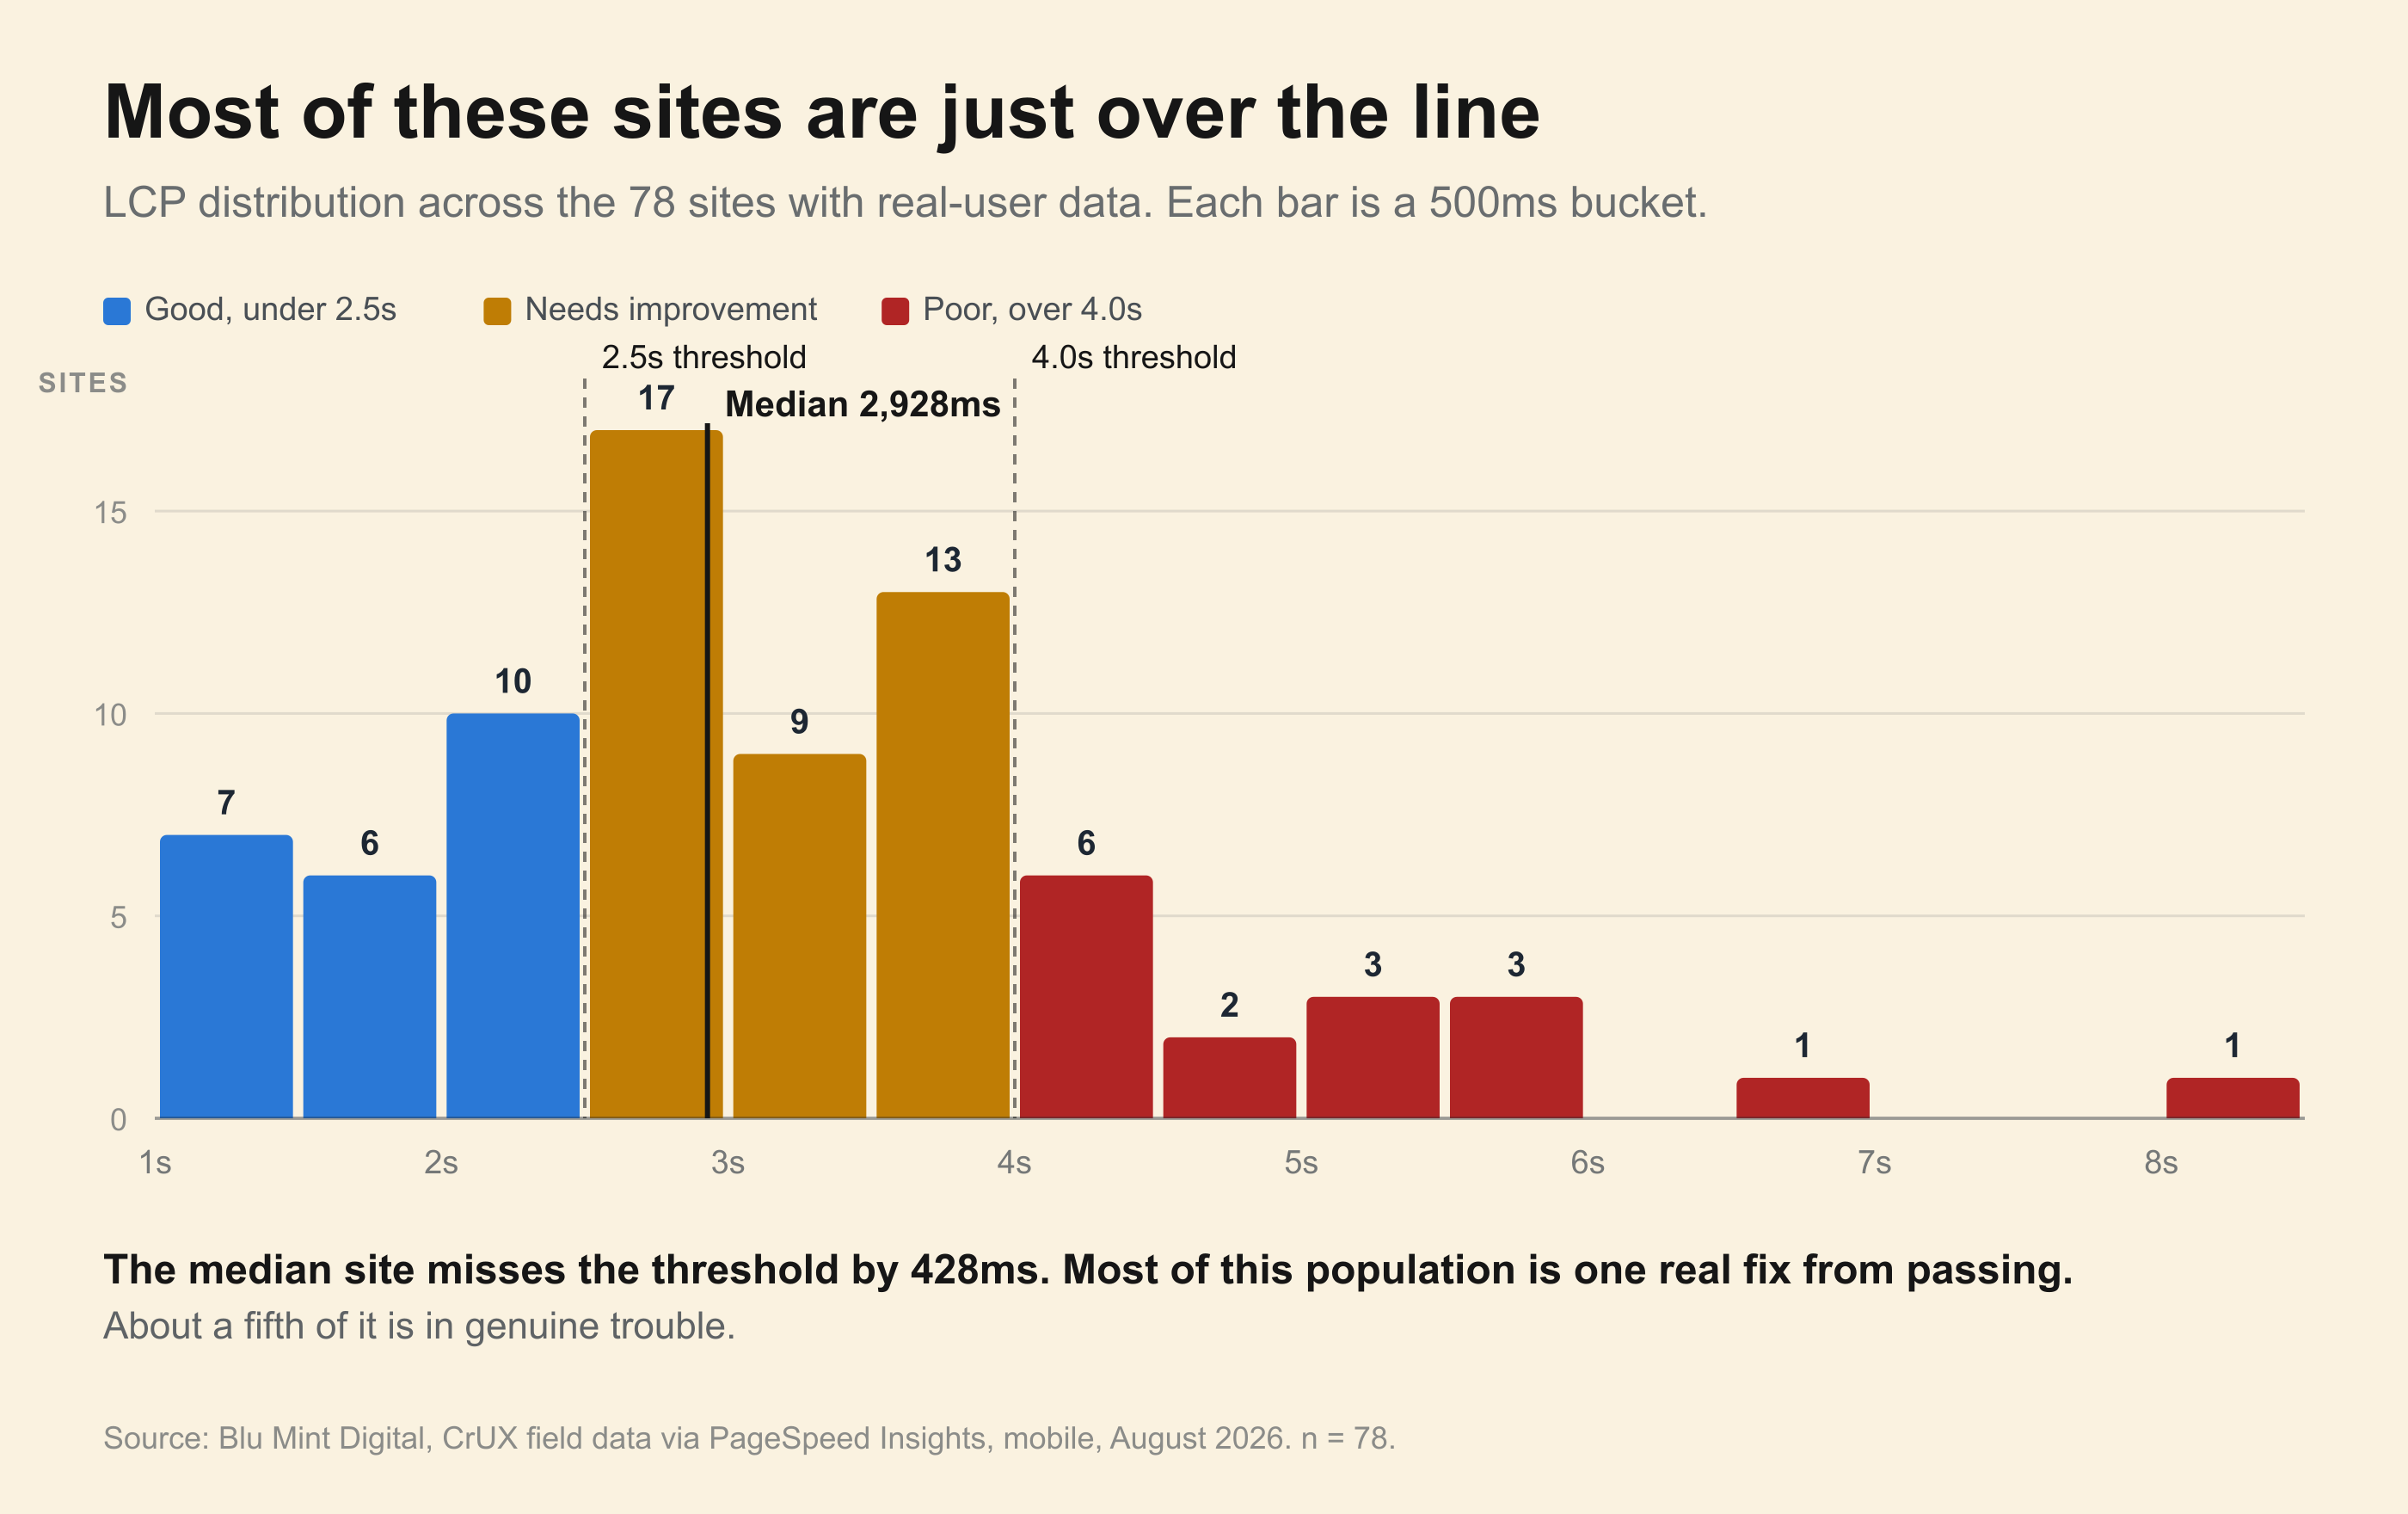
Looking at the LCP distribution on its own, the fastest homepage painted in 1,136ms and the slowest took 8,267ms. A quarter of the sample finished under 2,265ms, a quarter took longer than 3,823ms, and the slowest tenth exceeded 5,118ms.
Because the median site sits at 2,928ms, just 428ms past the 2,500ms line, most of these websites are not catastrophically broken. Roughly half the population sits in the "Needs Improvement" band where one targeted server, caching, font or hero-image fix can push them across the threshold. Roughly a fifth sit deep past four seconds where deeper architectural limits apply.
Three popular explanations that failed in the data
We expected the slowest sites to be explained by bloated plugin lists, oversized HTML documents, or outdated Elementor 3.x installs. None of those three held up.
1. Detected plugin count (r = -0.183)
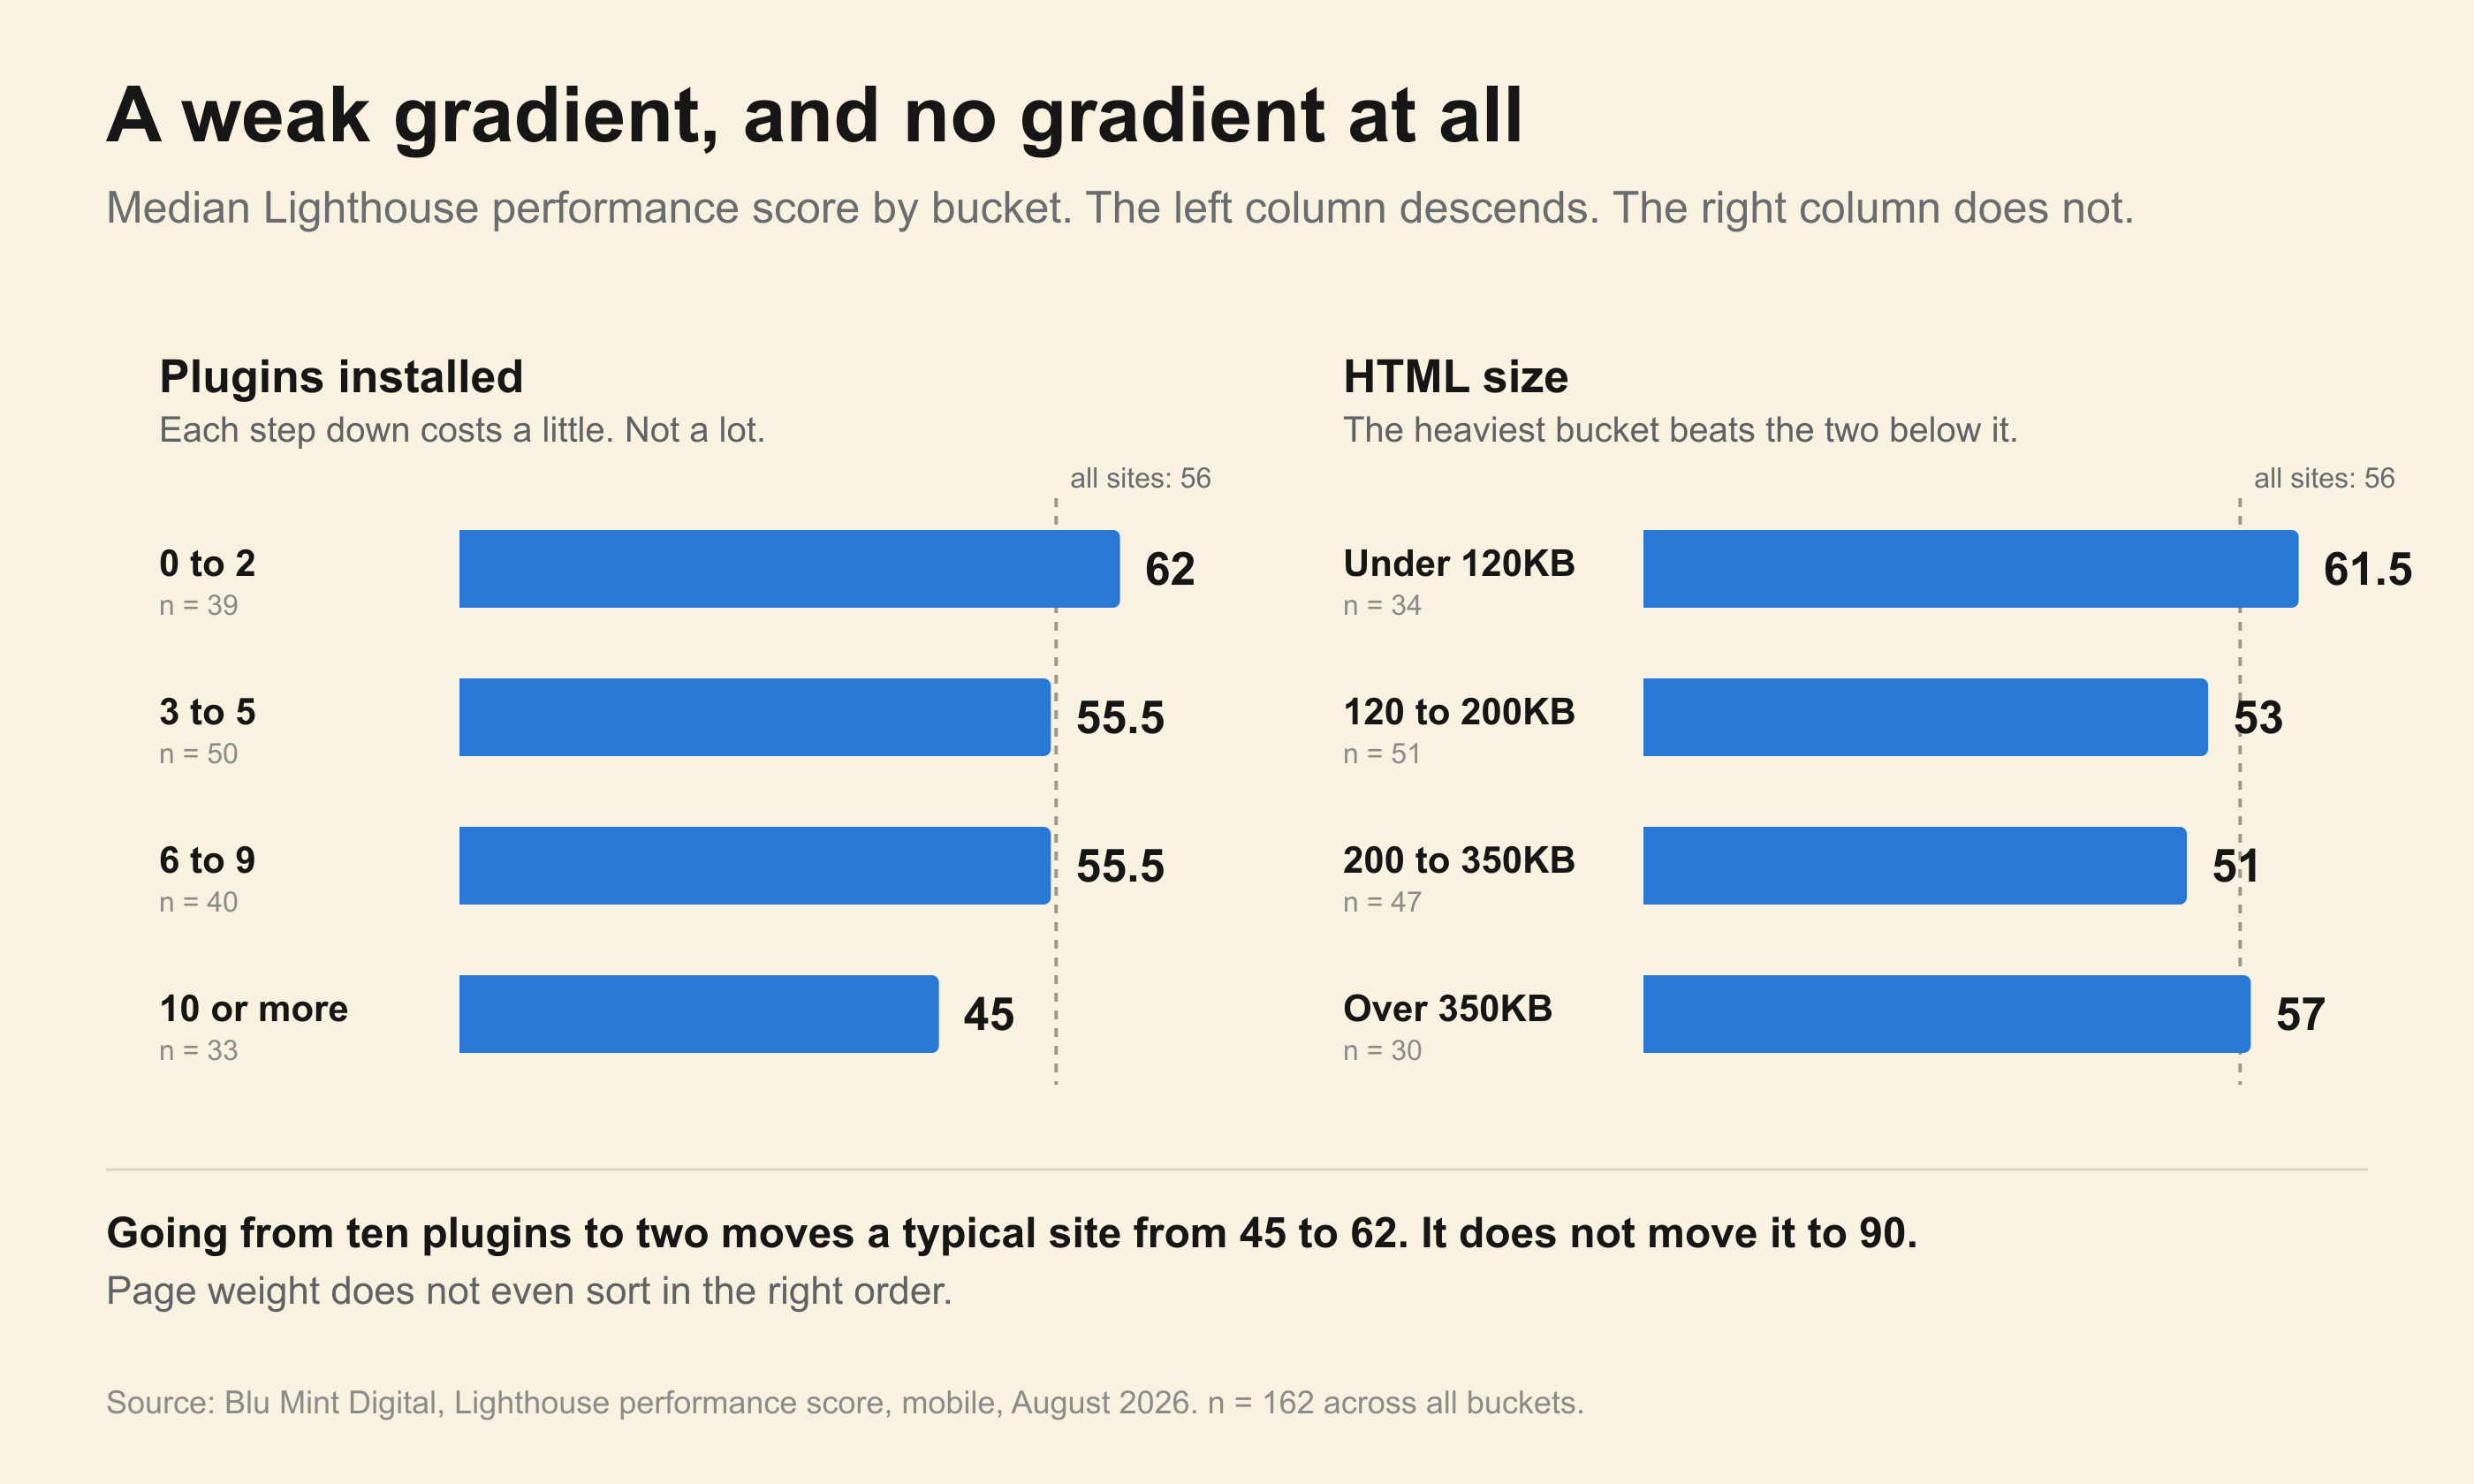
Across all 162 sites, the correlation between visible frontend plugin count and Lighthouse performance score was -0.183, explaining roughly 3% of the variation.
There is a real gradient between extremes: sites exposing two or fewer frontend plugins had a median score of 62, compared with 45 for sites exposing ten or more. Removing redundant addon packs is still sensible hygiene.
However, moving from ten plugins down to two shifts a typical site from 45 to 62, not from 45 to 90, and the two middle buckets sat at identical medians. Trimming plugins is a minor lever that often gets sold as a complete speed transformation.
2. HTML document weight (r = -0.033)
We expected heavy DOM and HTML payloads to be the clearest predictor of poor scores. Instead, correlation between HTML transfer size and performance score was -0.033, which is effectively zero.
Median homepage HTML was 190KB, the 90th percentile was 433KB, and the heaviest document reached 1.2MB. Yet the heaviest HTML bucket scored a median of 57, outperforming both middle weight buckets (53 and 51).
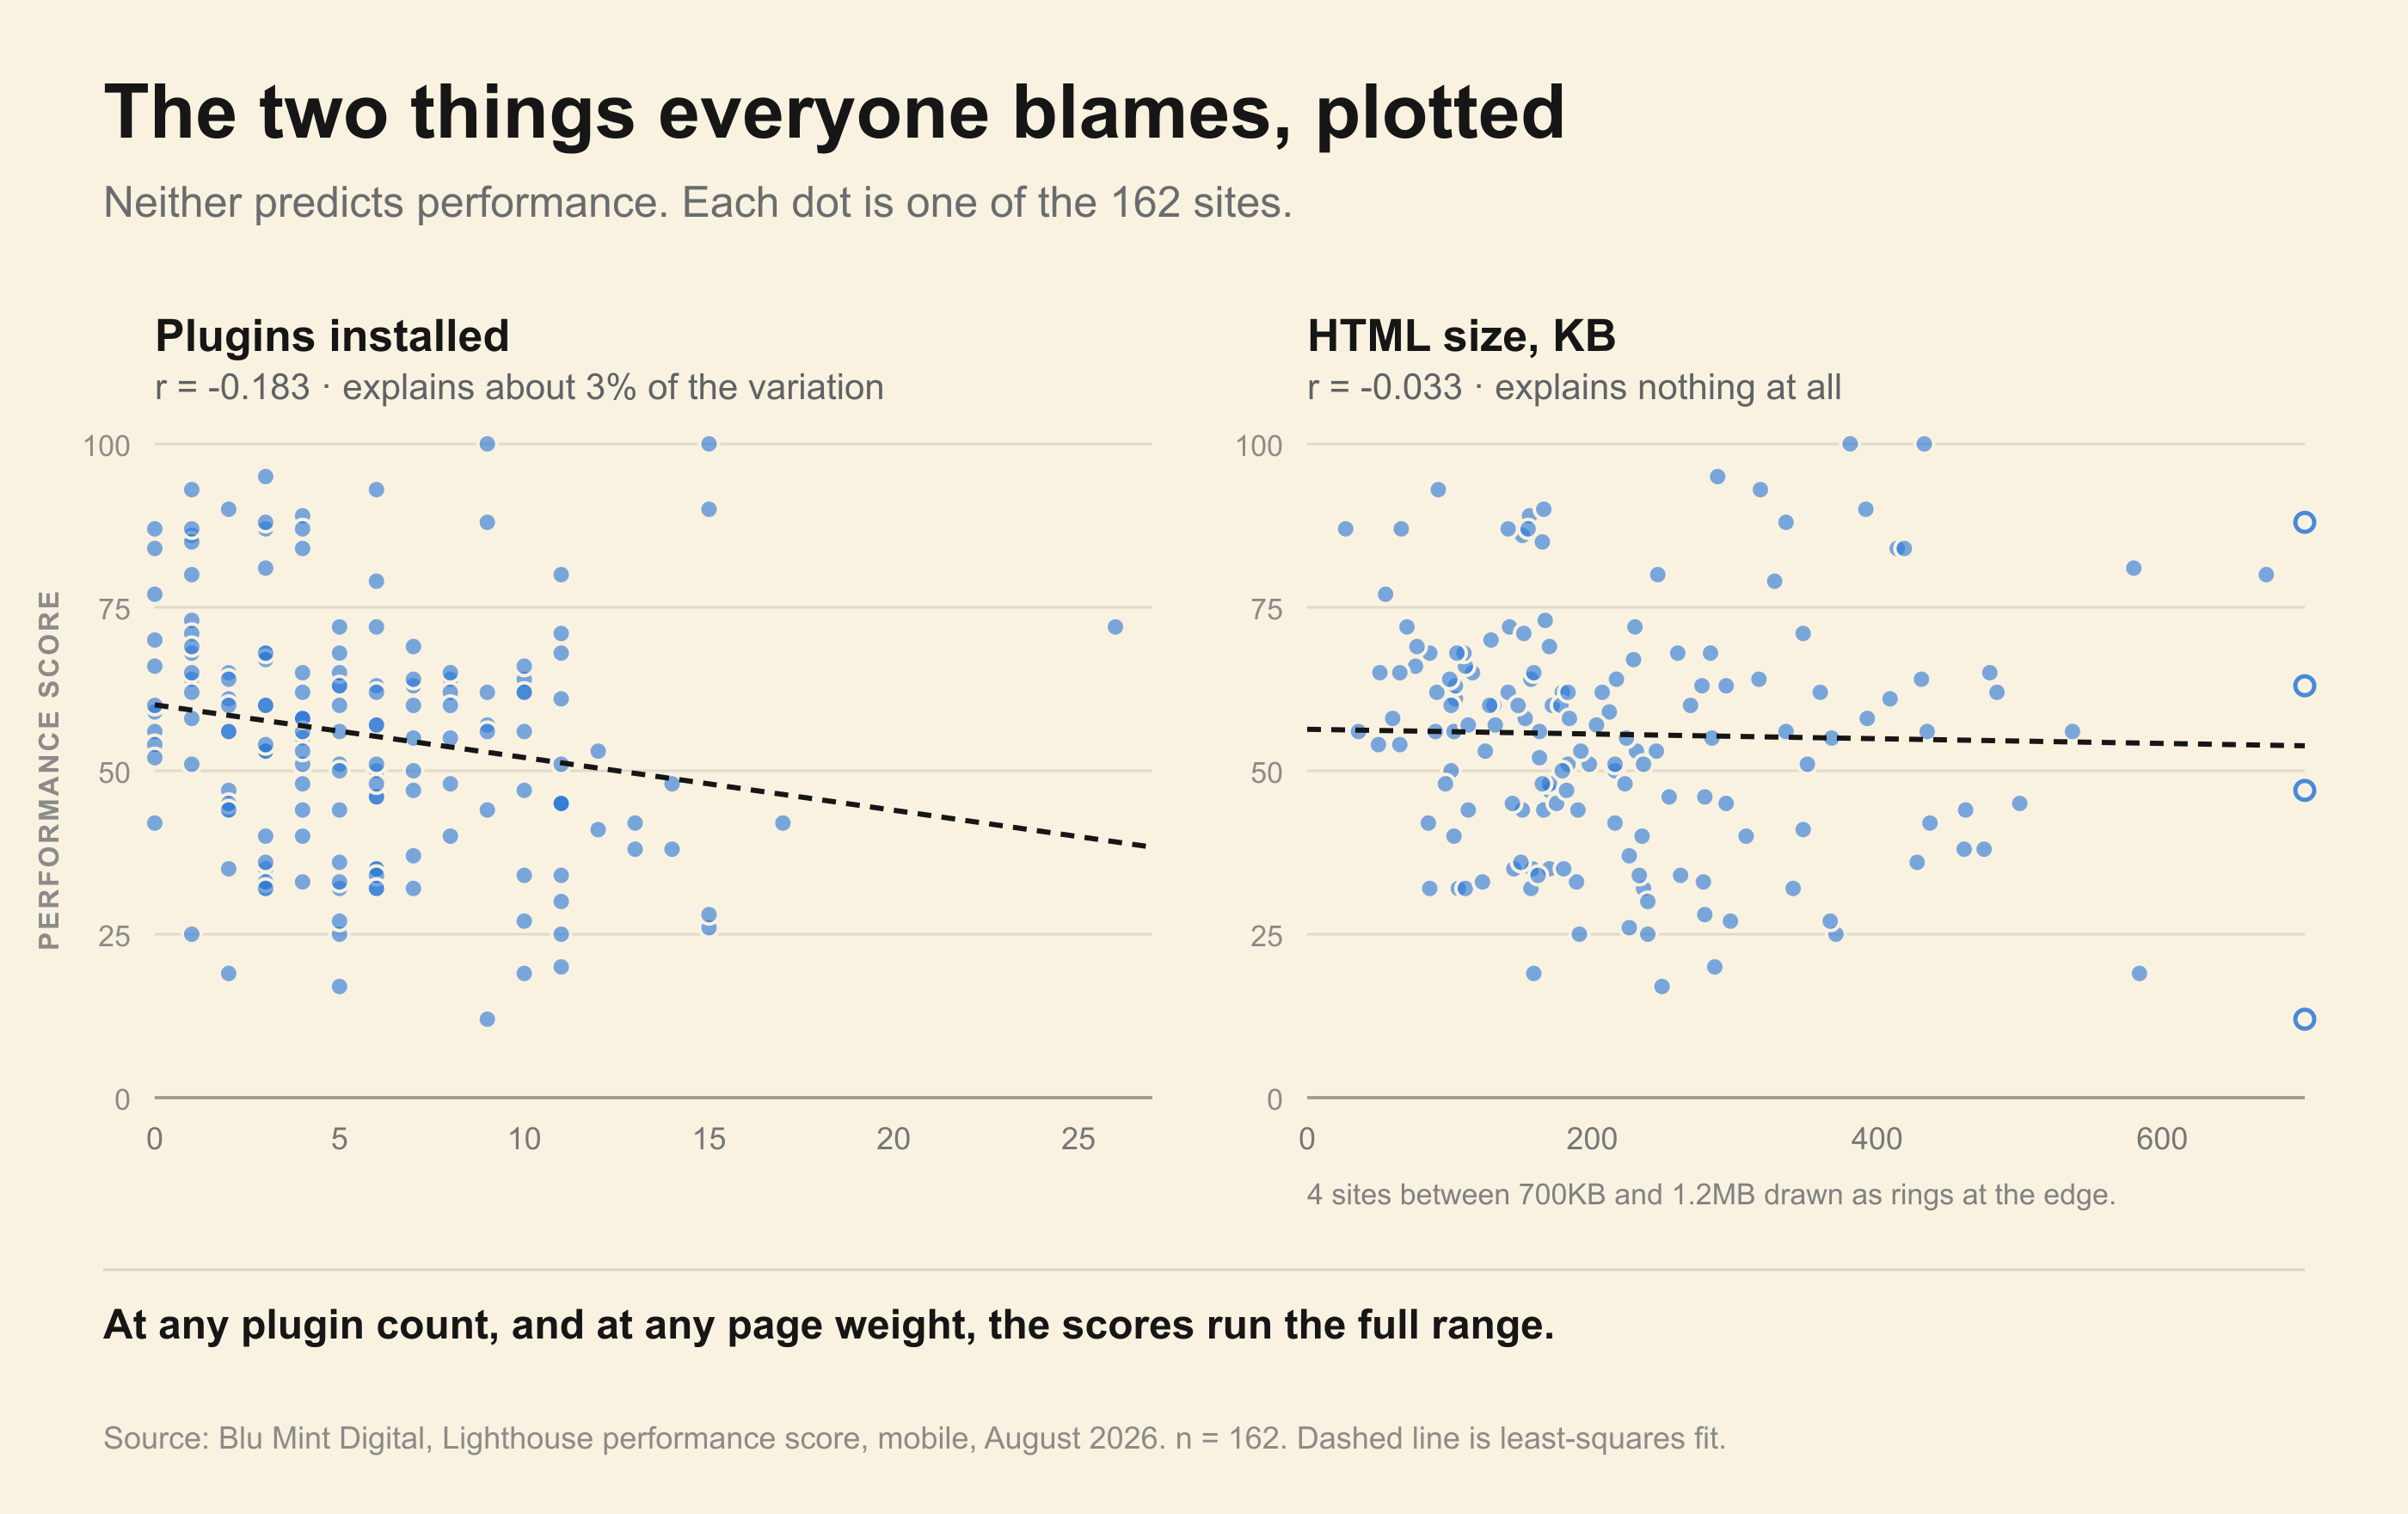
Why does HTML size predict almost nothing? Because LCP is governed primarily by server response time (TTFB), render-blocking stylesheets and scripts in the document head, and whether the hero image is prioritised or accidentally lazy-loaded. A 380KB page on fast Australian edge caching with a preloaded WebP hero paints quickly; a 95KB page on cheap overseas shared hosting queuing six CSS files ahead of an uncompressed banner crawls.
3. Elementor 3.x vs Elementor 4.x
Upgrading Elementor is essential for WordPress security, but in this dataset it showed zero performance difference on its own:
- Elementor 3.x (n = 42): median performance score 57
- Elementor 4.x (n = 112): median performance score 57
Simply updating the plugin version without enabling asset-loading settings, fixing hero media or addressing server delivery leaves performance unchanged.
Why Elementor Pro sites beat free sites in the field (despite losing in the lab)
Roughly 72% of our sample (116 sites) ran Elementor Pro. Those Pro sites loaded more plugins on average and scored slightly lower in Lighthouse lab tests: 55.5 median versus 58.5 for free Elementor sites.
Yet in real-user CrUX field data, the direction reversed completely: Elementor Pro sites recorded a median field LCP of 2,753ms compared with 3,772ms for free-version sites, a full second faster for real visitors.
Elementor Pro does not magically accelerate rendering. Only 13 free-version sites had enough traffic for CrUX data, and the reversal is almost certainly a budget and hosting selection effect: businesses paying for a Pro licence are far more likely to have hired an experienced developer and paid for managed Australian hosting or a CDN rather than five-dollar shared hosting. It is also the sharpest demonstration in our dataset of why relying on Lighthouse alone would have led to the exact wrong conclusion.
Study limitations worth stating plainly
- No non-Elementor control group: Because we only measured Elementor sites in this batch, this study measures how 162 Australian Elementor sites perform in the wild; it does not prove what 162 matched Squarespace, Shopify or custom WordPress sites would score on the same hosts.
- Homepages only, single API pass: Homepages are usually the heaviest or most tuned template on a domain, and single-run API pulls include day-to-day origin variance.
- WAF blocks on 24 domains: Security rules blocked automated HTML inspection on 24 sites, likely trimming part of the better-hosted upper tier.
- HTML-visible plugins only: Counting
/wp-content/plugins/asset paths measures plugins injecting frontend files into markup, not backend-only admin plugins.
None of those caveats alter the two core internal findings: real-user failures in this sample concentrated overwhelmingly in LCP rather than INP or CLS, and the three surface proxies people argue about most failed to separate fast Elementor sites from slow ones.
What to check if you run an Elementor website
If your business runs on Elementor, use this sequence before spending money on a rebuild:
- Read CrUX field data first: Test your homepage and top landing page in PageSpeed Insights and read the real-user section at the top. If your domain has no CrUX sample yet, treat Lighthouse as a bottleneck diagnostic rather than a pass/fail grade.
- Focus on mobile LCP: Check which specific element PageSpeed flags as your Largest Contentful Paint target. It is almost always a hero image (ensure it is sized properly, converted to WebP/AVIF, and preloaded rather than lazy-loaded) or a heading waiting on external Google Fonts.
- Fix server response and caching before hunting plugins: Full-page caching, Australian edge delivery and local font hosting consistently move LCP more than shaving three minor plugins. Our guide to website performance optimisation in Australia walks through those levers step by step.
- Decide honestly between tuning, lean WordPress and Next.js: If your site sits at 2.9 seconds on mobile LCP, targeted tuning will usually get you under 2.5 seconds for a modest budget. If you have already tuned caching, hosting and media and your commercial pages still drag, compare a lean WordPress build against a WordPress to Next.js migration where pages are pre-rendered ahead of visitor requests.
Frequently Asked Questions
What percentage of Australian Elementor websites pass Core Web Vitals?
In Blu Mint Digital's study of 162 confirmed Australian Elementor websites, 78 had sufficient real-user Chrome User Experience Report (CrUX) traffic to be graded. Of those 78 sites, 21 passed all three Core Web Vitals on mobile (27%).
Which Core Web Vital do Elementor sites fail most often?
Largest Contentful Paint (LCP) accounted for almost every failure in our sample. Only 29% of CrUX-eligible Elementor sites achieved a good mobile LCP under 2.5 seconds, whereas 93% achieved good Interaction to Next Paint (with zero poor scores) and 87% achieved good Cumulative Layout Shift.
Does having too many WordPress plugins cause Elementor sites to fail Core Web Vitals?
Plugin count had a much weaker effect than common WordPress advice suggests. Across 162 Australian Elementor sites, frontend plugin count correlated with performance scores at r = -0.183, explaining roughly 3% of the variation. Server response time, caching and hero-element delivery matter far more than plugin count alone.
Does upgrading to Elementor 4.x automatically make a website faster?
No. In our sample, Australian sites running Elementor 3.x (n = 42) and sites running Elementor 4.x (n = 112) recorded the exact same median Lighthouse performance score of 57. Updating is important for security, but real speed gains require configuring asset loading, optimising hero media and using fast hosting.
When should a business tune Elementor versus migrating to Next.js?
If your mobile LCP sits between 2.5 and 3.2 seconds and nobody has optimised hero image preloading, local fonts or page caching yet, tune your existing site first. Consider a WordPress to Next.js migration when your website is central to revenue, you have already exhausted sensible WordPress tuning, and you want instant pre-rendered page loads without builder maintenance drift.